📊 Dashboard Previews
Power BI Dashboard
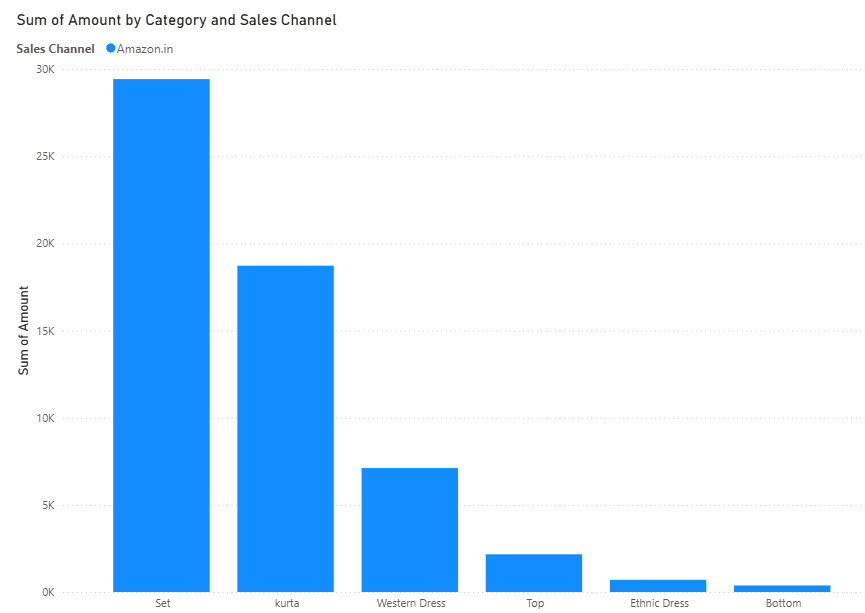
Sum Of Sales Amounts By Category
Tableau Dashboard
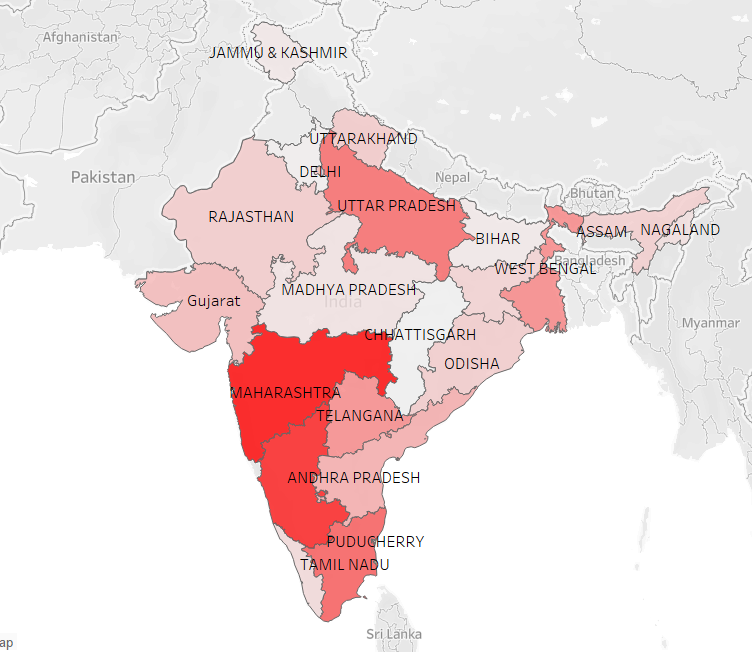
States Which Ordered The Most
Power BI Dashboard
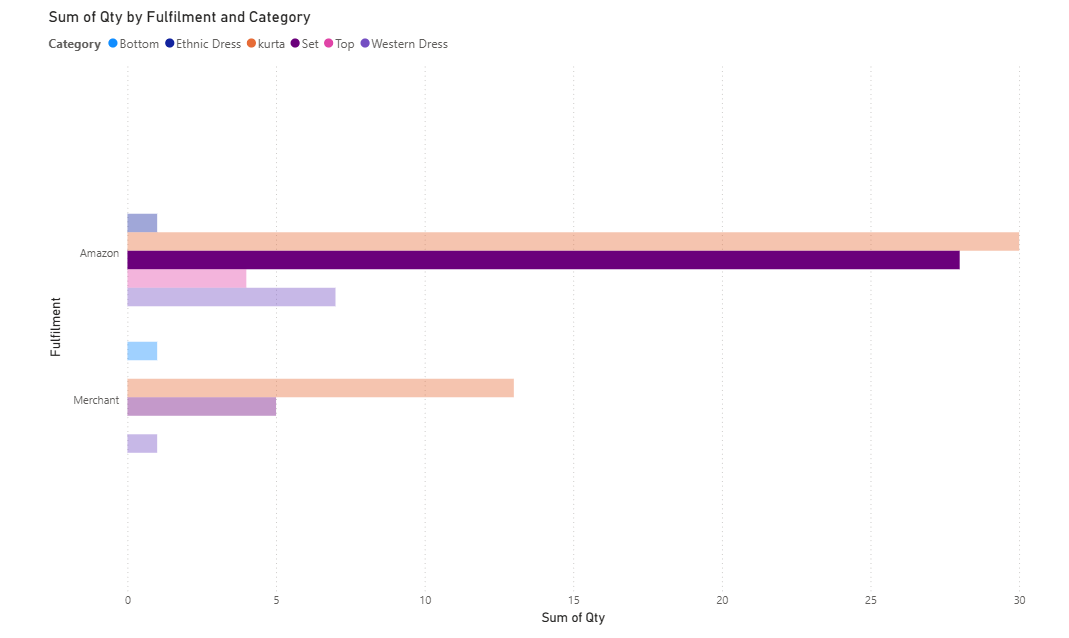
Sum Of Quantity By Fulfillment And Category
Tableau Dashboard
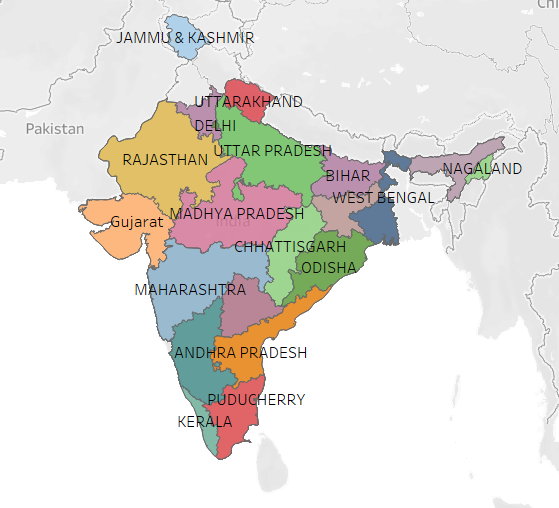
Category By States
Power BI Dashboard
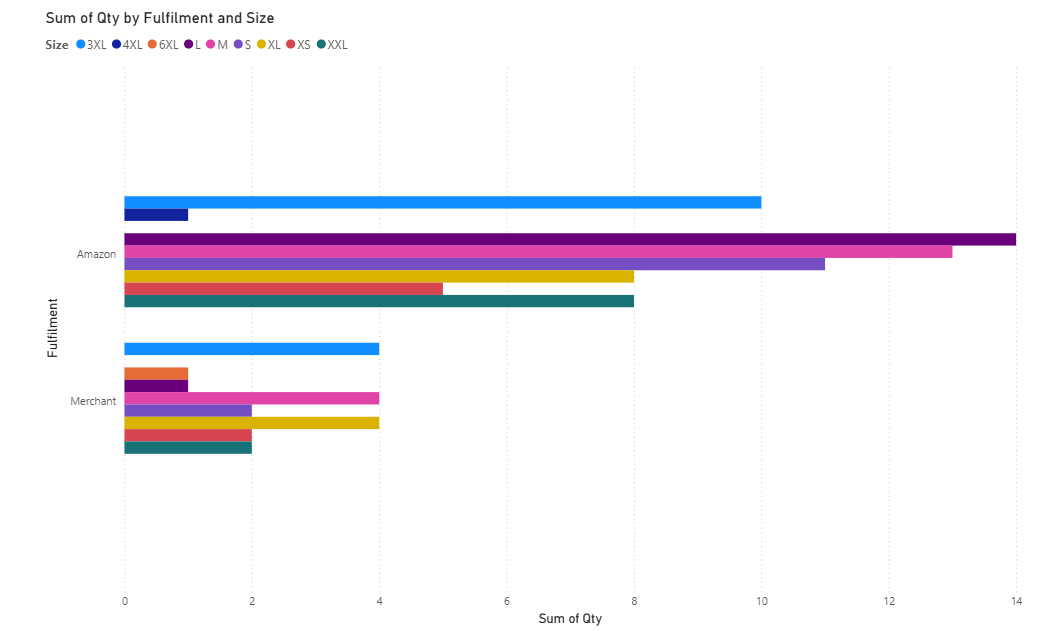
Sum Of Quantity by Fulfillment and Size
Tableau Dashboard
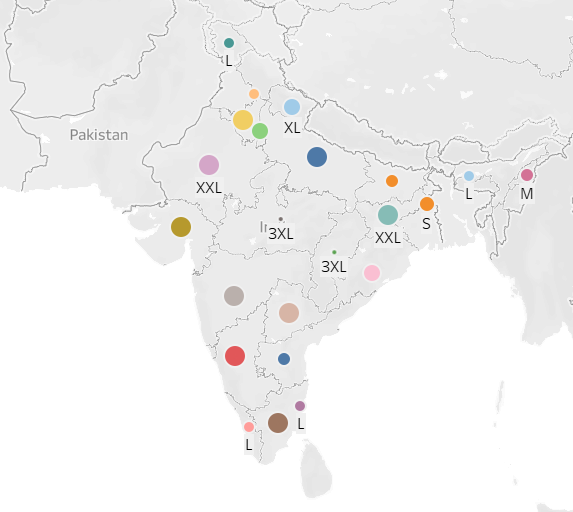
Sizes By State
Power BI Dashboard
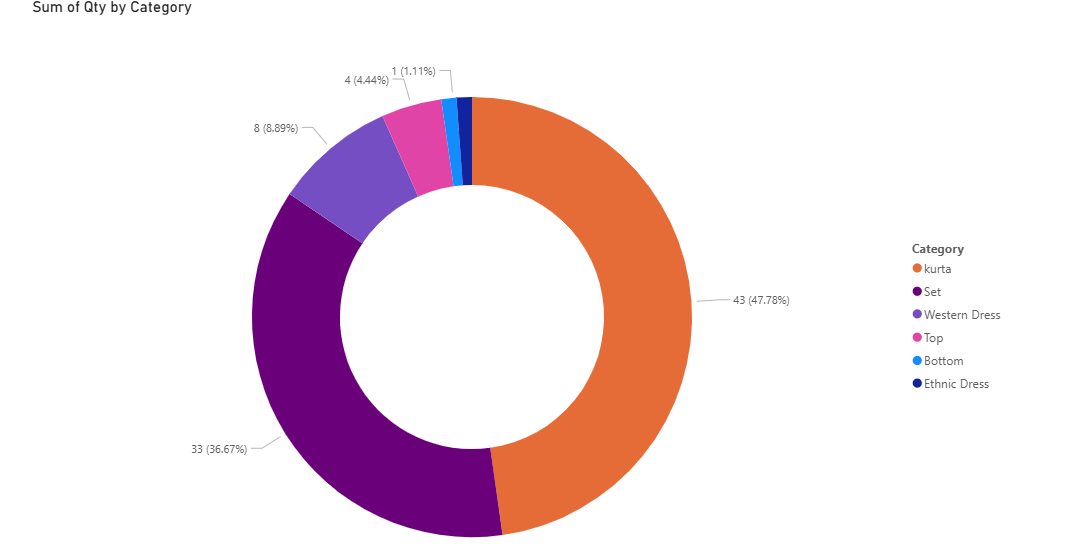
Sum Of Sizes by Category
Tableau Dashboard
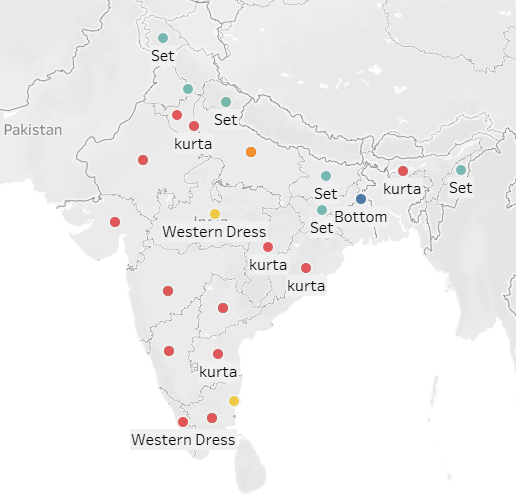
Categories By State
📁 Project Files
×
![]()